NYC taxi data
In this research, we prepare NYC taxi data for analysis.
- Yellow taxi trip records
- Green taxi trip records
- High volume for-hire vehicle trip records
- For-hire vehicle trip records
The prepared data sets are available at mob4cast: Multidimensional time series prediction with passenger/taxi flow data sets.
Yellow taxi trip records
Processing (pickup location, dropoff location, pickup datetime) information
Download data sets from TLC trip record data. For example, download the data set yellow_tripdata_2019-07.csv and process it as follows,
import pandas as pd

data = pd.read_csv('yellow_tripdata_2019-07.csv')

data = data.drop(['VendorID', 'tpep_dropoff_datetime', 'passenger_count', 'trip_distance', 'RatecodeID',
                  'store_and_fwd_flag', 'payment_type', 'fare_amount', 'extra', 'mta_tax', 'tip_amount',
                  'tolls_amount', 'improvement_surcharge', 'total_amount', 'congestion_surcharge'], axis = 1)
data
We focus on precessing trip data that covers the information of pickup location, dropoff location, and pickup datetime. Other columns would be dropped.
tpep_pickup_datetime	PULocationID	DOLocationID
0	2019-07-01 00:51:04	193	193
1	2019-07-01 00:46:04	234	25
2	2019-07-01 00:25:09	132	42
3	2019-07-01 00:33:32	132	142
4	2019-07-01 00:00:55	107	114
...	...	...	...
6310414	2019-07-29 16:34:53	137	7
6310415	2019-07-29 16:07:57	162	81
6310416	2019-07-29 16:01:31	70	89
6310417	2019-07-29 16:58:00	209	71
6310418	2019-07-29 16:16:00	87	33
6310419 rows × 3 columns
In this research, we only take into account the trip data in Manhattan, NYC. There are 69 pickup/dropoff zones, and the numbers are given as follows,
import numpy as np

manhattan = np.array([127, 128, 153, 120, 243, 244, 116, 42, 152, 166, 41, 74, 194, 24, 151,
                      238, 75, 239, 43, 236, 263, 143, 142, 262, 50, 237, 141, 140, 202, 163,
                      48, 230, 161, 162, 229, 246, 100, 68, 186, 233, 164, 170, 90, 234, 137,
                      158, 249, 107, 113, 224, 114, 125, 79, 211, 4, 144, 231, 148, 232, 13,
                      261, 45, 209, 87, 12, 88, 105, 104, 103])
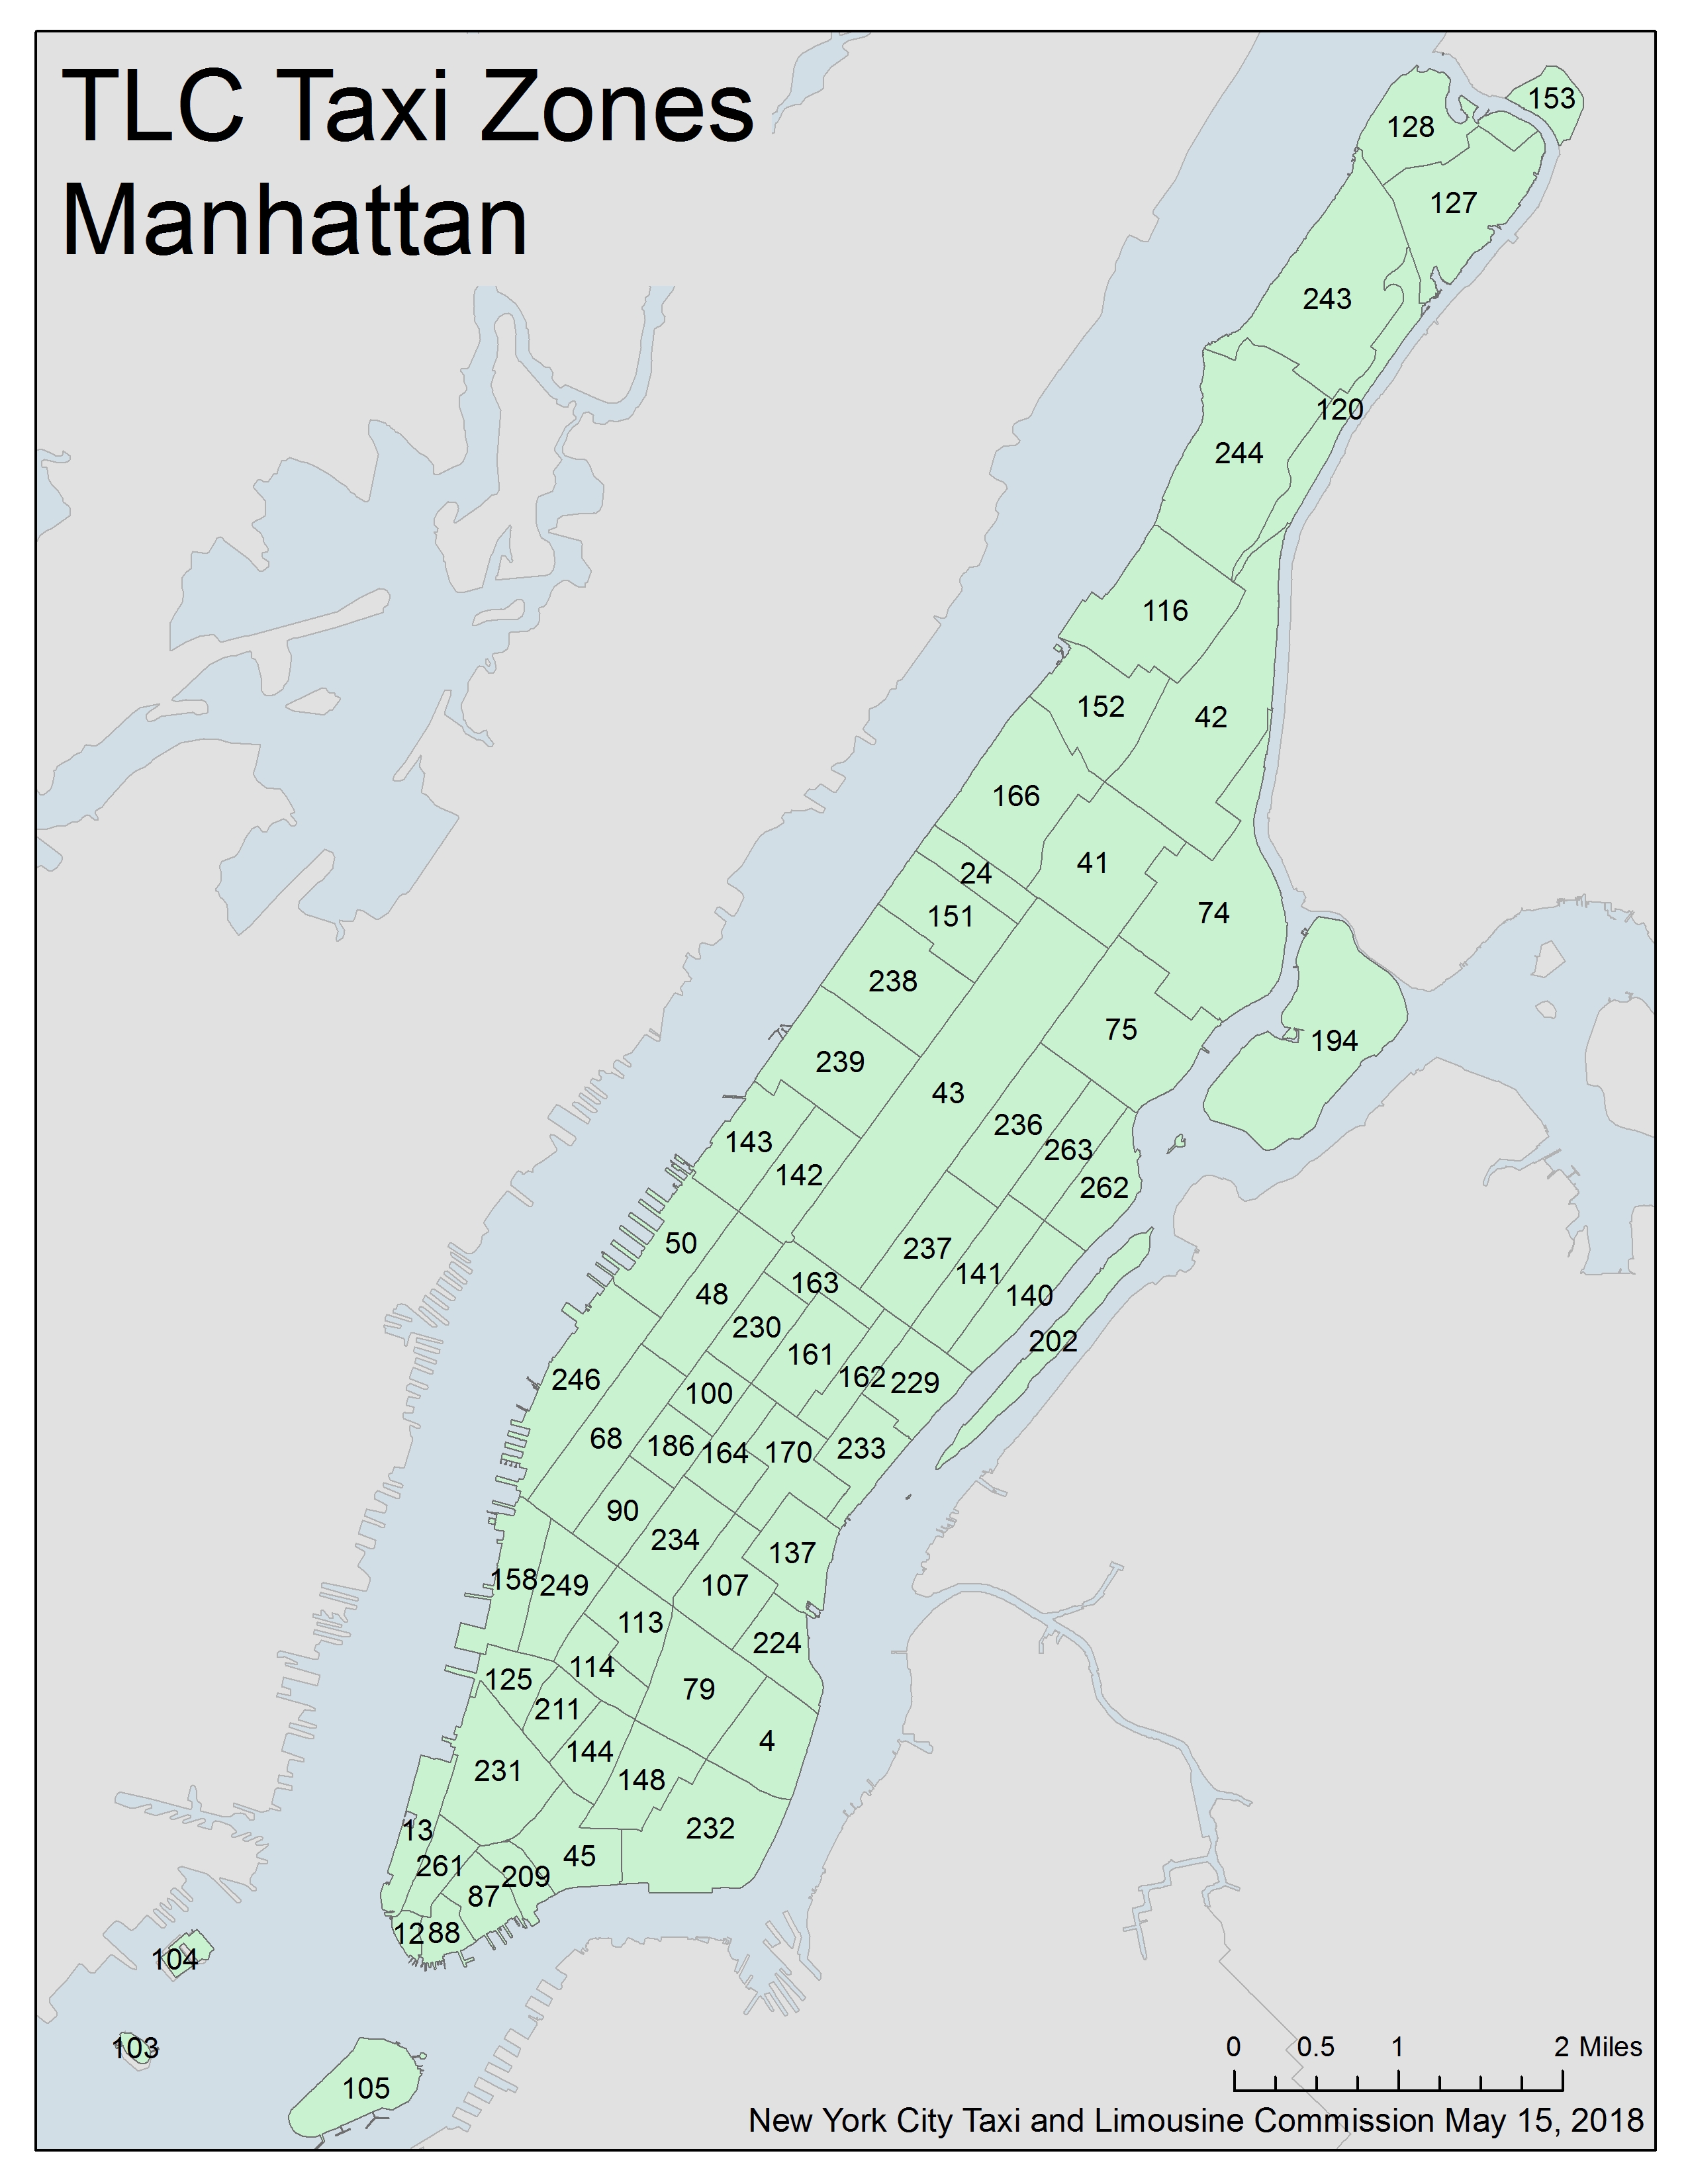
Figure 1. TCL taxi zones in Manhattan, NYC, USA. The source is from taxi_zone_map_manhattan.jpg.
Extract trip data in Manhattan, NYC. (How do I select rows from a DataFrame based on column values?)
data = data.loc[data['PULocationID'].isin(manhattan)]
data = data.loc[data['DOLocationID'].isin(manhattan)]
data
The output would be
tpep_pickup_datetime	PULocationID	DOLocationID
4	2019-07-01 00:00:55	107	114
5	2019-07-01 00:18:23	125	45
6	2019-07-01 00:28:09	142	68
7	2019-07-01 00:57:07	246	141
10	2019-07-01 00:17:29	170	142
...	...	...	...
6310306	2019-07-29 15:35:50	140	74
6310336	2019-07-29 16:09:00	234	142
6310353	2019-07-29 16:31:00	229	74
6310360	2019-07-27 13:06:37	151	113
6310386	2019-07-29 16:41:00	233	238
5263707 rows × 3 columns
Extract (day, hour) information from pickup datetime.
data.insert(3, "day", pd.DatetimeIndex(data['tpep_pickup_datetime']).day.values, True)
data.insert(4, "hour", pd.DatetimeIndex(data['tpep_pickup_datetime']).hour.values, True)
data = data.drop(['tpep_pickup_datetime'], axis = 1)
data
Aggregating hourly (pickup location, dropoff location) taxi flow
trip = data.groupby(['PULocationID', 'DOLocationID', 'day', 'hour'])['day'].count().reset_index(name = 'count')
trip
The output would be
PULocationID	DOLocationID	day	hour	count
0	4	4	1	0	1
1	4	4	1	3	1
2	4	4	1	6	1
3	4	4	1	9	1
4	4	4	1	10	1
...	...	...	...	...	...
1212975	263	263	31	19	18
1212976	263	263	31	20	11
1212977	263	263	31	21	11
1212978	263	263	31	22	3
1212979	263	263	31	23	3
1212980 rows × 5 columns
Here, these five columns refer to pickup location, dropoff location, day, hour, and count, respectively. The last column is the trip count of each specific dimension setting.
import numpy as np

np.savez_compressed('yellow_tripdata_7.npz', trip.values)
One can use np.load('yellow_tripdata_7.npz')['arr_0'] to open the .npz file.
Green taxi trip records
import pandas as pd
import numpy as np

data = pd.read_csv('green_tripdata_2019-07.csv')

data = data.drop(['VendorID', 'lpep_dropoff_datetime', 'store_and_fwd_flag', 'RatecodeID', 'passenger_count',
                  'trip_distance', 'fare_amount', 'fare_amount', 'extra', 'mta_tax', 'tip_amount',
                  'tolls_amount', 'ehail_fee', 'improvement_surcharge', 'total_amount', 'payment_type',
                  'trip_type', 'congestion_surcharge'], axis = 1)

manhattan = np.array([127, 128, 153, 120, 243, 244, 116, 42, 152, 166, 41, 74, 194, 24, 151,
                      238, 75, 239, 43, 236, 263, 143, 142, 262, 50, 237, 141, 140, 202, 163,
                      48, 230, 161, 162, 229, 246, 100, 68, 186, 233, 164, 170, 90, 234, 137,
                      158, 249, 107, 113, 224, 114, 125, 79, 211, 4, 144, 231, 148, 232, 13,
                      261, 45, 209, 87, 12, 88, 105, 104, 103])
data = data.loc[data['PULocationID'].isin(manhattan)]
data = data.loc[data['DOLocationID'].isin(manhattan)]

data.insert(3, "day", pd.DatetimeIndex(data['lpep_pickup_datetime']).day.values, True)
data.insert(4, "hour", pd.DatetimeIndex(data['lpep_pickup_datetime']).hour.values, True)
data = data.drop(['lpep_pickup_datetime'], axis = 1)

trip = data.groupby(['PULocationID', 'DOLocationID', 'day', 'hour'])['day'].count().reset_index(name = 'count')
np.savez_compressed('green_tripdata_7.npz', trip.values)
trip
The output would be
PULocationID	DOLocationID	day	hour	count
0	12	236	9	7	1
1	13	13	7	20	1
2	13	48	12	16	1
3	13	239	23	13	1
4	24	24	1	8	1
...	...	...	...	...	...
67750	263	263	23	13	1
67751	263	263	26	9	1
67752	263	263	29	17	1
67753	263	263	29	18	2
67754	263	263	31	9	1
67755 rows × 5 columns
High volume for-hire vehicle trip records
Download data sets from TLC trip record data. For example, download the data set fhvhv_tripdata_2019-07.csv and process it as follows,
import pandas as pd

data = pd.read_csv('fhvhv_tripdata_2019-07.csv')
data = data.drop(['hvfhs_license_num', 'dispatching_base_num', 'dropoff_datetime', 'SR_Flag'], axis = 1)
data
We focus on precessing trip data that covers the information of pickup location, dropoff location, and pickup datetime. Other columns would be dropped. The output would be
pickup_datetime	PULocationID	DOLocationID
0	2019-07-01 00:12:33	228	89
1	2019-07-01 00:41:26	97	188
2	2019-07-01 00:18:50	81	220
3	2019-07-01 00:05:12	78	69
4	2019-07-01 00:29:01	69	239
...	...	...	...
20303306	2019-07-31 23:46:39	138	25
20303307	2019-07-31 23:34:36	231	50
20303308	2019-07-31 23:15:17	244	169
20303309	2019-07-31 23:31:03	169	119
20303310	2019-07-31 23:54:59	42	41
20303311 rows × 3 columns
There are a large amount of trip records. We only take into account the pickup and dropoff in Manhattan.
import numpy as np

manhattan = np.array([127, 128, 153, 120, 243, 244, 116, 42, 152, 166, 41, 74, 194, 24, 151,
                      238, 75, 239, 43, 236, 263, 143, 142, 262, 50, 237, 141, 140, 202, 163,
                      48, 230, 161, 162, 229, 246, 100, 68, 186, 233, 164, 170, 90, 234, 137,
                      158, 249, 107, 113, 224, 114, 125, 79, 211, 4, 144, 231, 148, 232, 13,
                      261, 45, 209, 87, 12, 88, 105, 104, 103])
data = data.loc[data['PULocationID'].isin(manhattan)]
data = data.loc[data['DOLocationID'].isin(manhattan)]
Extract (day, hour) information from pickup datetime.
data.insert(3, "day", pd.DatetimeIndex(data['pickup_datetime']).day.values, True)
data.insert(4, "hour", pd.DatetimeIndex(data['pickup_datetime']).hour.values, True)
data = data.drop(['pickup_datetime'], axis = 1)
data
The output would be
PULocationID	DOLocationID	day	hour
5	48	42	1	0
19	141	87	1	0
21	141	141	1	0
22	246	170	1	0
23	100	263	1	0
...	...	...	...	...
20303280	148	186	31	23
20303281	164	230	31	23
20303282	163	79	31	23
20303307	231	50	31	23
20303310	42	41	31	23
6442962 rows × 4 columns
Aggregating hourly (pickup location, dropoff location) taxi flow
trip = data.groupby(['PULocationID', 'DOLocationID', 'day', 'hour'])['day'].count().reset_index(name = 'count')
trip
The output would be
PULocationID	DOLocationID	day	hour	count
0	4	4	1	0	1
1	4	4	1	1	1
2	4	4	1	3	1
3	4	4	1	7	1
4	4	4	1	9	1
...	...	...	...	...	...
1650811	263	263	31	19	2
1650812	263	263	31	20	6
1650813	263	263	31	21	3
1650814	263	263	31	22	3
1650815	263	263	31	23	2
1650816 rows × 5 columns
Here, these five columns refer to pickup location, dropoff location, day, hour, and count, respectively. The last column is the trip count of each specific dimension setting.
import numpy as np

np.savez_compressed('fhvhv_tripdata_7.npz', trip.values)
For-hire vehicle trip records
import pandas as pd
import numpy as np

data = pd.read_csv('fhv_tripdata_2019-07.csv')
data = data.drop(['dispatching_base_num', 'dropoff_datetime', 'SR_Flag'], axis = 1)

manhattan = np.array([127, 128, 153, 120, 243, 244, 116, 42, 152, 166, 41, 74, 194, 24, 151,
                      238, 75, 239, 43, 236, 263, 143, 142, 262, 50, 237, 141, 140, 202, 163,
                      48, 230, 161, 162, 229, 246, 100, 68, 186, 233, 164, 170, 90, 234, 137,
                      158, 249, 107, 113, 224, 114, 125, 79, 211, 4, 144, 231, 148, 232, 13,
                      261, 45, 209, 87, 12, 88, 105, 104, 103])
data = data.loc[data['PULocationID'].isin(manhattan)]
data = data.loc[data['DOLocationID'].isin(manhattan)]

data.insert(3, "day", pd.DatetimeIndex(data['pickup_datetime']).day.values, True)
data.insert(4, "hour", pd.DatetimeIndex(data['pickup_datetime']).hour.values, True)
data = data.drop(['pickup_datetime'], axis = 1)

trip = data.groupby(['PULocationID', 'DOLocationID', 'day', 'hour'])['day'].count().reset_index(name = 'count')
np.savez_compressed('fhv_tripdata_7.npz', trip.values)
trip
The output would be
PULocationID	DOLocationID	day	hour	count
0	4.0	4.0	1	9	1
1	4.0	4.0	1	13	1
2	4.0	4.0	24	10	1
3	4.0	4.0	24	14	1
4	4.0	4.0	29	5	1
...	...	...	...	...	...
21131	263.0	263.0	1	13	1
21132	263.0	263.0	2	14	2
21133	263.0	263.0	6	18	1
21134	263.0	263.0	14	9	1
21135	263.0	263.0	24	7	1
21136 rows × 5 columns
NYC taxi flow tensor
So far, we have each .npz file for saving taxi flow information of different kinds of vehicles. By using the data from July to December of 2019, we can process data with the following codes:
import numpy as np

manhattan = np.array([127, 128, 153, 120, 243, 244, 116, 42, 152, 166, 41, 74, 194, 24, 151,
                      238, 75, 239, 43, 236, 263, 143, 142, 262, 50, 237, 141, 140, 202, 163,
                      48, 230, 161, 162, 229, 246, 100, 68, 186, 233, 164, 170, 90, 234, 137,
                      158, 249, 107, 113, 224, 114, 125, 79, 211, 4, 144, 231, 148, 232, 13,
                      261, 45, 209, 87, 12, 88, 105, 104, 103])

# Yellow taxi
tensor = np.zeros((69, 69, 31 * 24))
data = np.load('yellow_tripdata_7.npz')['arr_0']
for j in range(data.shape[0]):
    tensor[np.where(manhattan == data[j, 0])[0][0], np.where(manhattan == data[j, 1])[0][0],
                int(data[j, 3] + (data[j, 2] - 1) * 24)] = data[j, 4]
for i in range(8, 13):
    if i == 8 or i == 10 or i == 12:
        sub_tensor1 = np.zeros((69, 69, 31 * 24))
        data = np.load('yellow_tripdata_{}.npz'.format(i))['arr_0']
        for j in range(data.shape[0]):
            sub_tensor1[np.where(manhattan == data[j, 0])[0][0], np.where(manhattan == data[j, 1])[0][0],
                        int(data[j, 3] + (data[j, 2] - 1) * 24)] = data[j, 4]
    else:
        sub_tensor1 = np.zeros((69, 69, 30 * 24))
        data = np.load('yellow_tripdata_{}.npz'.format(i))['arr_0']
        data = np.delete(data, np.where(data[:, 2] == 31), 0)
        for j in range(data.shape[0]):
            sub_tensor1[np.where(manhattan == data[j, 0])[0][0], np.where(manhattan == data[j, 1])[0][0],
                        int(data[j, 3] + (data[j, 2] - 1) * 24)] = data[j, 4]
    tensor = np.append(tensor, sub_tensor1, axis = 2)
np.savez_compressed('yellow_taxi_tensor.npz', tensor)
It turns out these taxi flow data are multidimensional tensor. Now, the data are available at mob4cast: Multidimensional time series prediction with passenger/taxi flow data sets.
Putting all taxi trips of different vehicles together, we have a fourth-order tensor of size .
This is a large-scale data set, one can use GPU to speed up calculations using cupy. Please replace import numpy as np as import cupy as np.
Reference
- Todd W. Schneider. Analyzing 1.1 Billion NYC Taxi and Uber Trips, with a Vengeance (An open-source exploration of the city’s neighborhoods, nightlife, airport traffic, and more, through the lens of publicly available taxi and Uber data).
